Stock trades disclosed by members of Congress since August 2024, with the return after each one.
Source: House and Senate financial disclosuresThe AI market analyst for everyday investors

TICKERNVDA · NASDAQ
TIMEFRAME 1D
TIMEFRAME 1D
LEVELS FOUNDSUPPORT 190.01
RESISTANCE 216.92
RESISTANCE 216.92
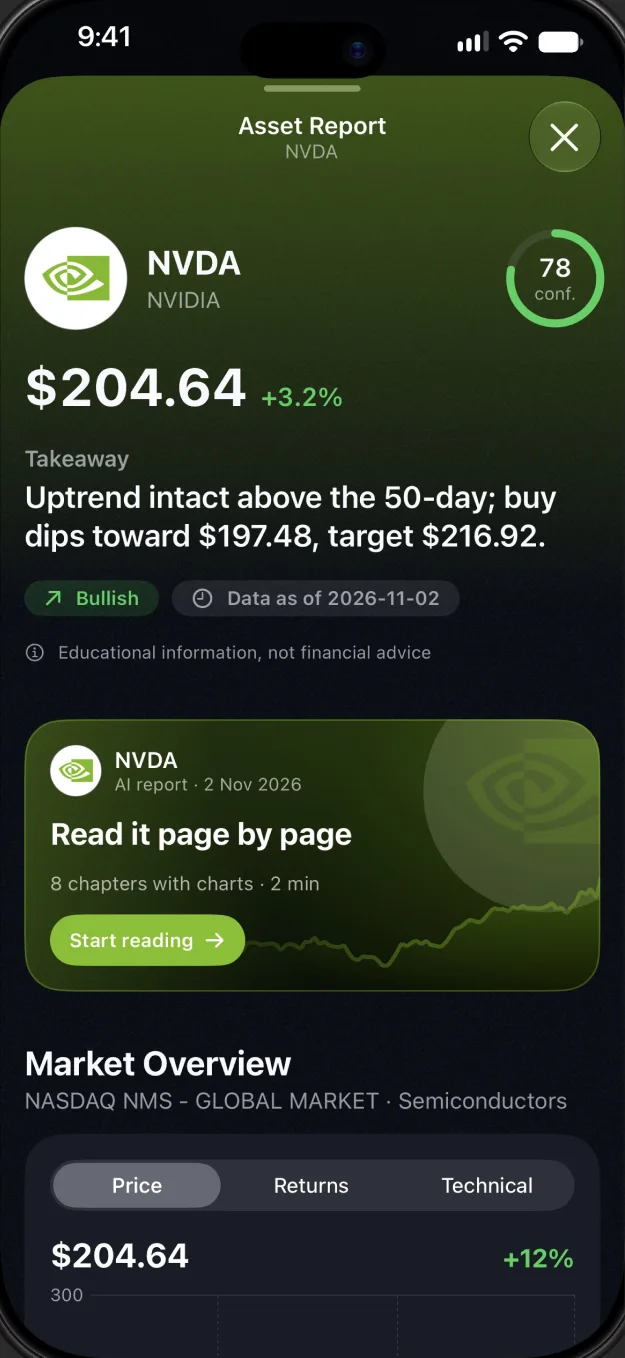
AINVDA · Bullish78%Uptrend above the 50-day
Candlewise turns charts, filings and market news into plain-language analysis. Start with the free chart analyzer, go deeper with Trade AI for iPhone.
Congress filings · Oct 2026
T Purchase · David J. Taylor (R-OH) · $1K–$15K
STX Sale · Kevin Hern (R-OK) · $15K–$50K
MCD Sale · Pete Sessions (R-TX) · $1K–$15K
CSCO Purchase · Diana Harshbarger (R-TN) · $15K–$50K
TSM Purchase · Cleo Fields (D-LA) · $1K–$15K
LRCX Purchase · David J. Taylor (R-OH) · $1K–$15K
ASML Sale · Kevin Hern (R-OK) · $15K–$50K
What the analyst reads, every day
Every report draws on the same public data a professional desk watches. Here is how much of it Candlewise already holds.
Buys and sells by company executives and directors, read straight from the filings.
Source: SEC EDGARFull chart analyses completed for Trade AI users since August 2026.
 Written with OpenAI models
US-listed stocks and ETFs with prices, news and fundamentals, plus major crypto.
 Finnhub, Yahoo Finance, CoinGecko, Binance
Counts from the Trade AI database on November 2, 2026. Candlewise is not endorsed by these providers.

Charts have never been easier to find, and never been harder to read.
Every broker app shows candles, indicators and a dozen lines. Very few tell you what the picture means: is the trend intact, is momentum fading, where would the idea be wrong.
Candlewise was built to answer that. We are an AI analysis company: our models read the chart, the news and the public filings, and walk you through them the way an analyst would.
No jargon wall. No signals for sale. A clear read you can check yourself.
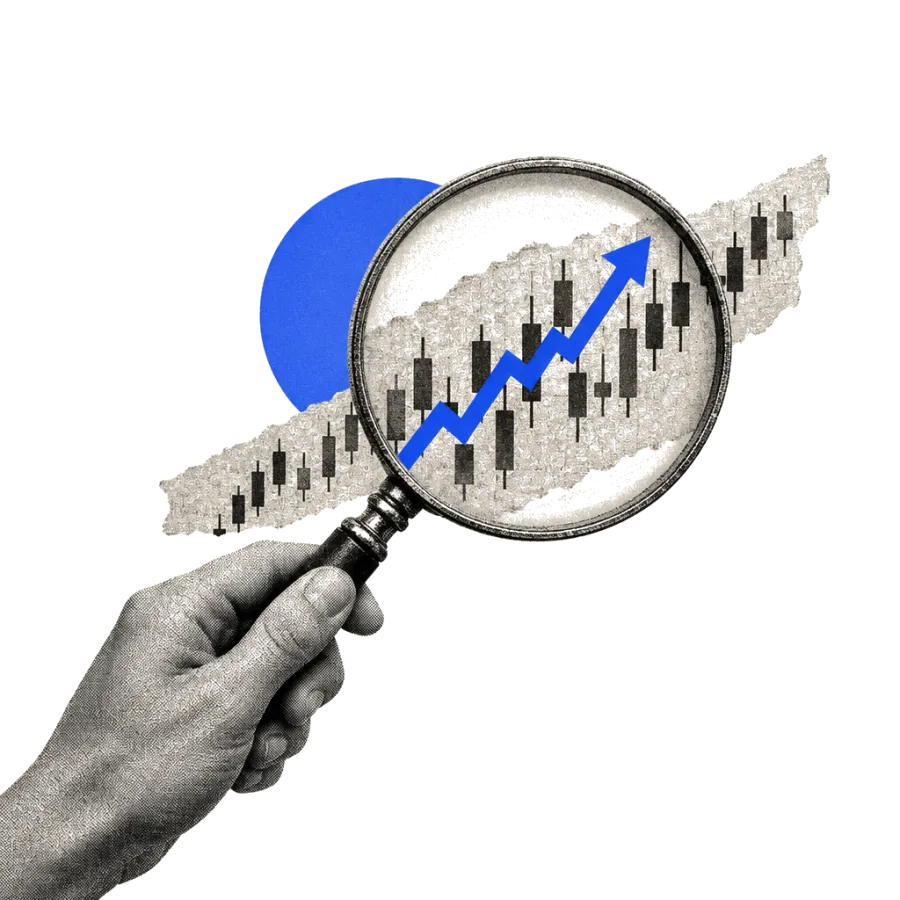
Drop a chart. Watch it get read.
Works with screenshots from TradingView, your broker or any charting app. Stocks, ETFs, crypto, gold and forex. Two free analyses a day, no account.
Reading the chart…
–
AI VERDICT · CONFIDENCE
–TREND
–SENTIMENT
–VOLATILITY
Entry, stop-loss and two targets
Open the full report in the app
Educational analysis of what the chart shows. Not a recommendation to buy or sell. Your screenshot goes to the AI model and is not stored on this site.
One analyst, three ways to use it
WEB · FREE
Chart Analyzer
Upload a screenshot of any chart and get the trend, momentum and key levels in seconds.
Analyze a chart IPHONETrade AI
Full trade setups, Congress and insider trades, market news and alerts for your watchlist.
See the app GUIDESLearn
Plain-language guides to candlesticks, levels and choosing a broker, so you can check the AI's work.
Start readingTrade AI, the analyst in your pocket
The web analyzer gives you the verdict. Our iPhone app gives you the plan and keeps watching after you close the chart.
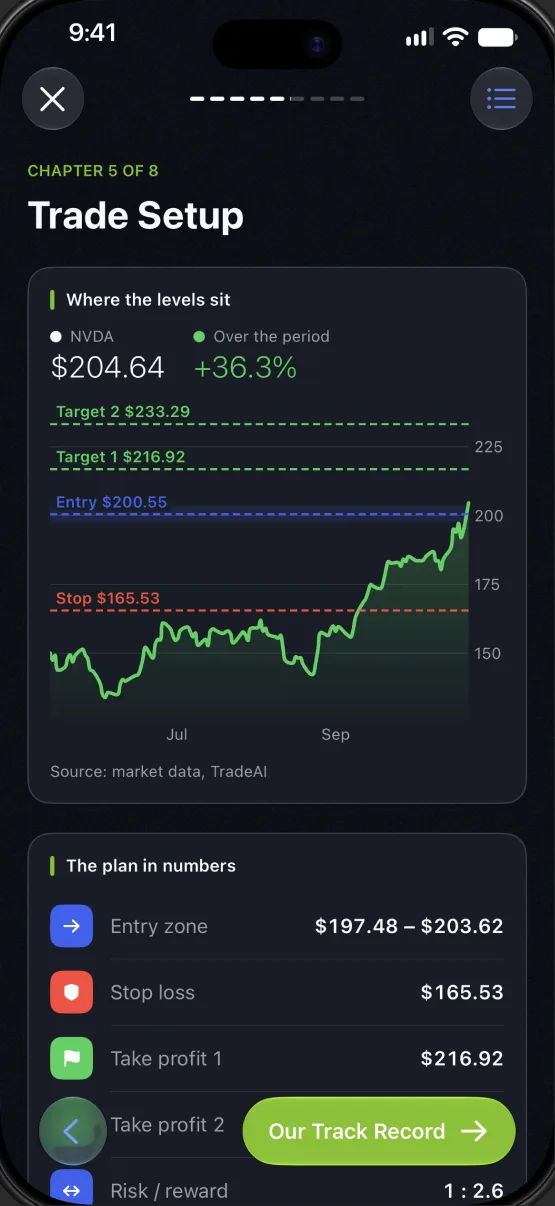
The full trade setup
Every report ends in a plan: entry zone, stop-loss and two targets, with best, likely and worst case scenarios and the risks behind them.
- Entry$200.55
- Stop$165.53
- Target 1$216.92
- Target 2$233.29
 Charts in the app by TradingView
Follow the smart money
What members of Congress and company insiders bought and sold, as soon as the filing is public.


News for your tickers
Market-moving stories for what you hold, each with a short read on what it means.

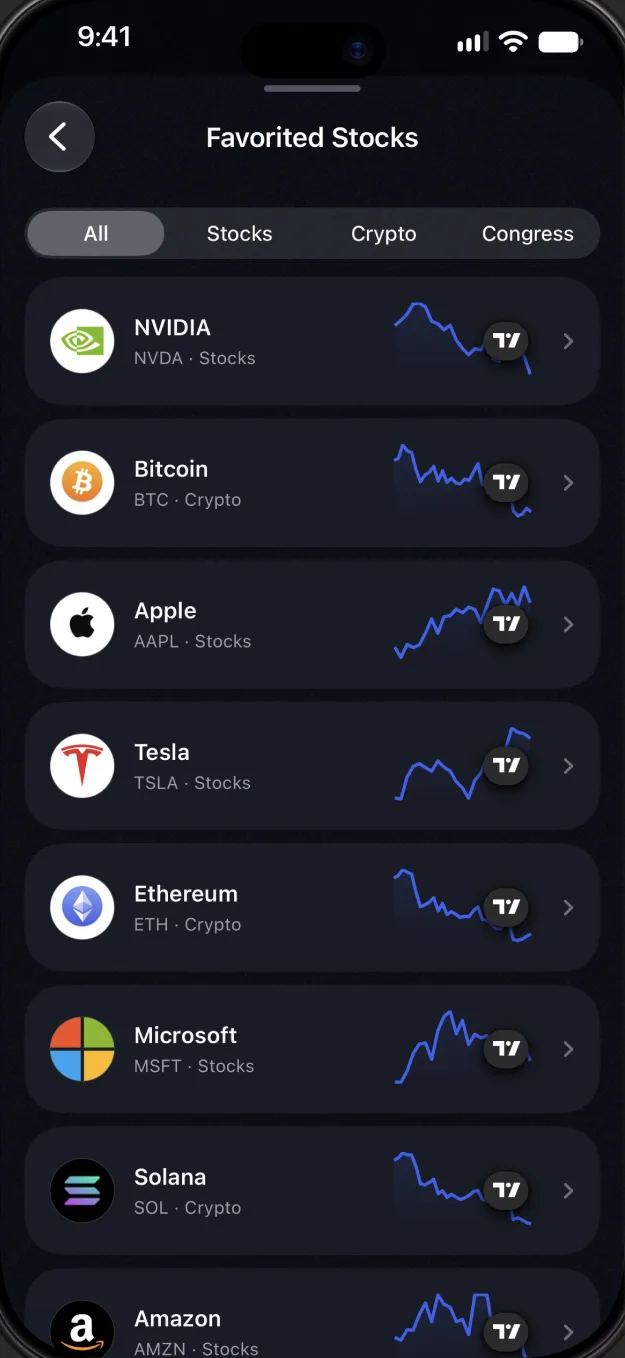
One watchlist for everything
Stocks, crypto and Congress members side by side, each with a sparkline, and alerts when something moves.
 Download on theApp Store
Free to download, with a 7-day free trial on the monthly plan. iPhone, iOS 18 or later.
Example output of one analysis
Making charts make sense
We turn charts, filings and market news into structured, plain-language analysis: what the trend is, how strong it is, who is buying, and the prices that matter. You stay in charge of the decision.
Where to open an account
Read our broker checklist
Webull
STOCKS & ETFS
Commission-free US stocks and ETFs, with charting and paper trading
Visit WebullTradingView
CHARTS
The charting platform behind the charts in our app, with alerts and screeners
Visit TradingViewThese are partner links. If you open an account through them we may earn a commission. It never changes what we write. Read the disclosure.
$0Extra cost to you. Crypto is not SIPC or FDIC insured.
LEARNBY CANDLEWISE
Candlesticks, explained: one shape, four prices
How to read the body and wicks, why timeframes change the picture, and the five patterns worth knowing. 6 min read.
Read more
Candlesticks, explained
Open, close, high and low in one shape, and the patterns worth knowing.
Read more
Support and resistance
Why price keeps stopping at the same places, and how to mark them.
Read moreChoosing a broker
What to compare before you open a stock or crypto account.
Read more